Night Lights
Nightlights are often used but not always understood. Let’s change that here.
This section is inspired from Yohan Iddawela’s excellent overview of nightlights.
Using nightlights to measure economic activity
There were a few studies in the 1990s and 2000s that looked at using nighttime luminosity as a proxy for economic activity such as Elvidge et al. (1997), and Doll et al. (2006).
A paper published in the prestigious economics journal, the American Economic Review (Henderson et al., 2012), marked turning point.
It argued that growth rates of nightlights were useful in two scenarios:
When countries lacked high-quality official GDP estimates;
Where official sub-national GDP was unavailable
They also argued that luminosity data is available immediately, as opposed to official GDP data which can have delayed publication of a few months.
Nightlights are now one of the standard method for calculating subnational economic activity.
In light of the widespread use of nightlights, numerous studies neglect to discuss the specifics of what they capture, as well as their advantages and disadvantages.
As a result, let us examine a few of the most important concerns.

What economic activities do nightlights capture?
It’s quite vague to say that nightlights captures ‘economic activity’. What exactly do we mean by economic activity?
In the Henderson et al. paper, they use nightlights as a proxy for real GDP growth.
But taking a step back, GDP is typically measured in three ways:
Adding up all of the consumption in an economy (this includes investments and government spending)
Adding up all of the income earned in an economy
Adding up the value of all things produced in an economy
On aggregate for an entire country, all of these things should equal one another.
However, we need to be careful about double counting. For example, combining production values with income and consumption figures without accounting for overlaps could distort things.
The bottom line: nightlights can capture certain elements of consumption and production.
Not all satellite data is the same
There are actually three different sources of free night time data:
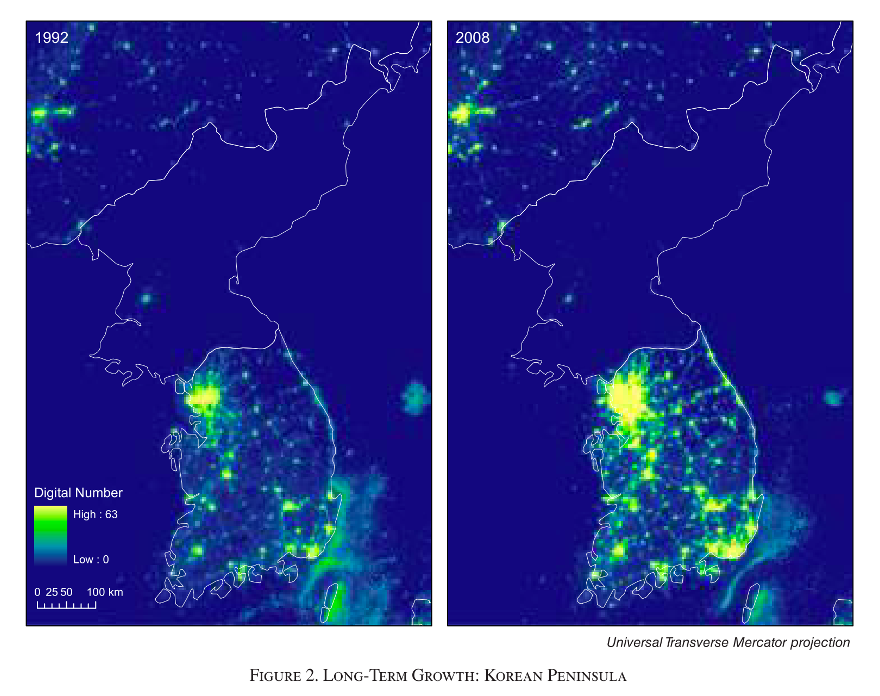
1. DMSP-OLS (low-resolution data)
It is:
- Available from 1992-2013,
- Low resolution (each pixel is ~1km x 1km),
- The most widely used luminosity dataset in spatial economics
It also faces an issue of ‘overglow’. This is where light from one region is picked up by another region.
2. VIIRS (provided by Colorado School of Mines)
Source 2: VIIRS data (provided by Colorado School of Mines and NOAA)
This is:
- Available from 2012-present
- Doesn’t experience overglow
- High resolution (each pixel is ~500m x 500m)
- An off-the-shelf product and has been corrected for cloud cover and stray light,
However, this data has ongoing problems with snowfall.Snow reflects light. And during Jan and Feb 2021 (the middle of the pandemic), European countries were reporting record-levels of luminosity. This didn’t square with reality. Instead, this was caused by snow. We will still be using this as our primary data for this workshop. Colorado School of Mines’s (CSM) VIIRS data is the main dataset used in most studies (of those that use high resolution luminosity data).
3. VIIRS Black Marble
NASA’s Black Marble is quite recent—it was only released in 2021.This dataset is more ‘raw’. It provides the tools for pixel-level processing. And it claims to do things differently by providing ‘cleaner’ luminosity images.
‘Clean’ luminosity images sounds simple in practice. It’s essentially luminosity data that’s free from sources of noise. But in reality, this is incredibly hard to do.
In order to provide ‘clean’ luminosity images we need to account for a few things:
Surface-reflection: luminosity doesn’t reflect off the Earth’s surface (e.g. light bouncing off snow).
Atmospheric-reflection: luminosity doesn’t reflect off the Earth’s atmosphere (e.g. light bouncing of aerosols or clouds).
Stray light (which comes from the sun directly into the Satellite’s instruments) doesn’t contaminate the images.
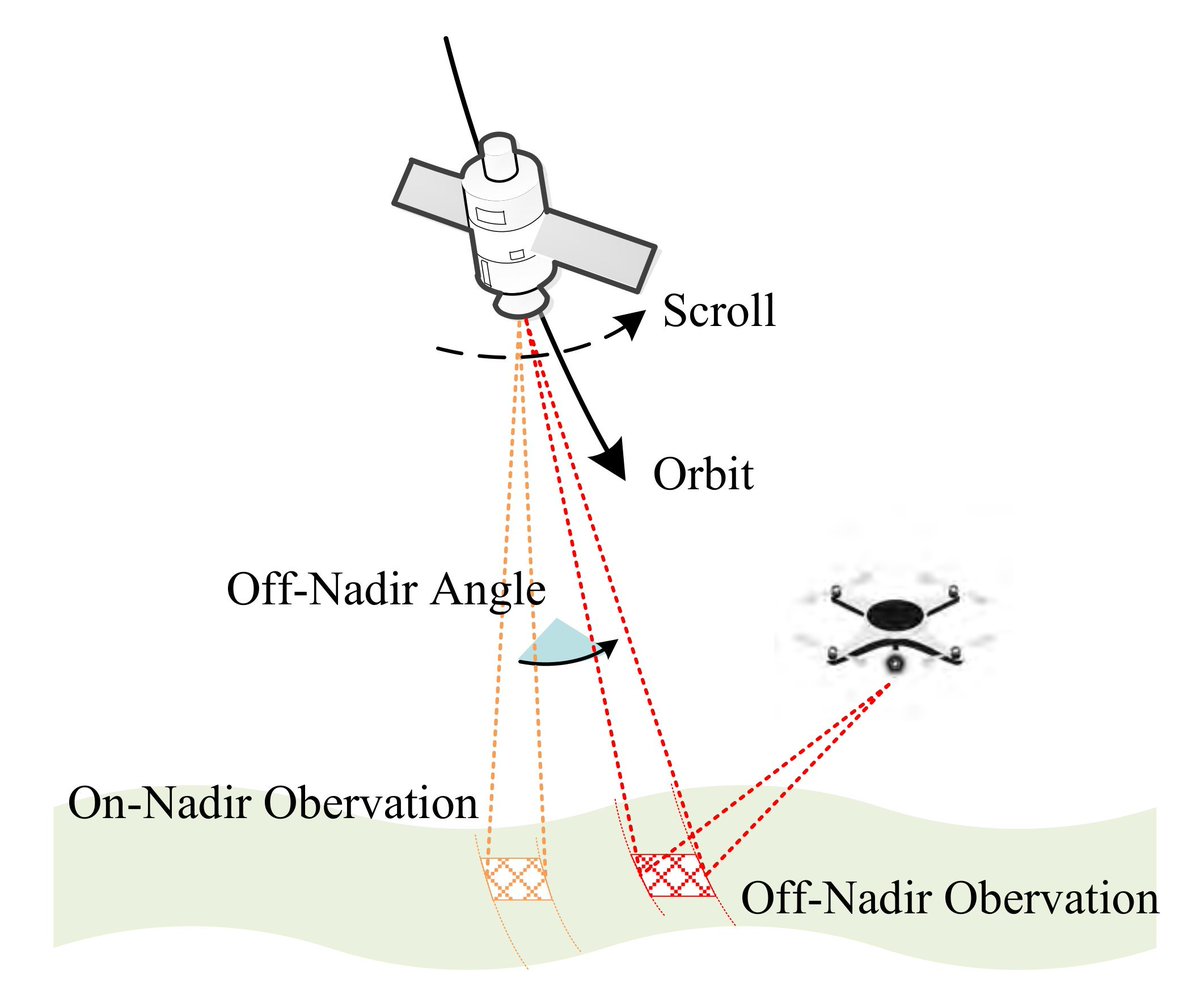
Other issues: such as vegetation obscuring satellite images, the satellite’s angle from the Earth changing luminosity scores, or other outliers like lightning.
I find this GIF from NASA to be pretty helpful in understanding all of these things:
With NASA’s Black Marble you’re able to determine:
- The angle of the satellite
- Which pixels are obscure by clouds
- snowfall & foliage adjusted estimates
This is important because:
- Snowfall and water reflects light
- Foliage and clouds obscures the view of satellites
- Satellite angles impacts its perception of luminosity

Some important things to note:
- Pixel-level cleaning of data is computationally intensive.
- It requires cloud computing to do this at scale.
- However, once cleaned, NASA’s luminosity estimates are less volatile than Colorado School of Mine’s VIIRs estimates.
- Due to stray light, Black Marble has many missing values for northern countries from Jun-Aug.
Further readings
Henderson, J. Vernon, Adam Storeygard, and David N. Weil. 2012. Measuring Economic Growth from Outer Space American Economic Review, 102 (2): 994-1028. Replication data